3x Lead Acquisition Rate, Inbound Website CRO Project
Role
Associate Product Marketing Manager
Company
Jamboree Education
Team
2 Designer, 1 Developer, 2 Content Writers
Key Skills
Product Management, Product Design, Growth Marketing, Documentation, Analytics

The Impact: 3x Lead Acquisition Rate
In my role leading this project, we achieved:
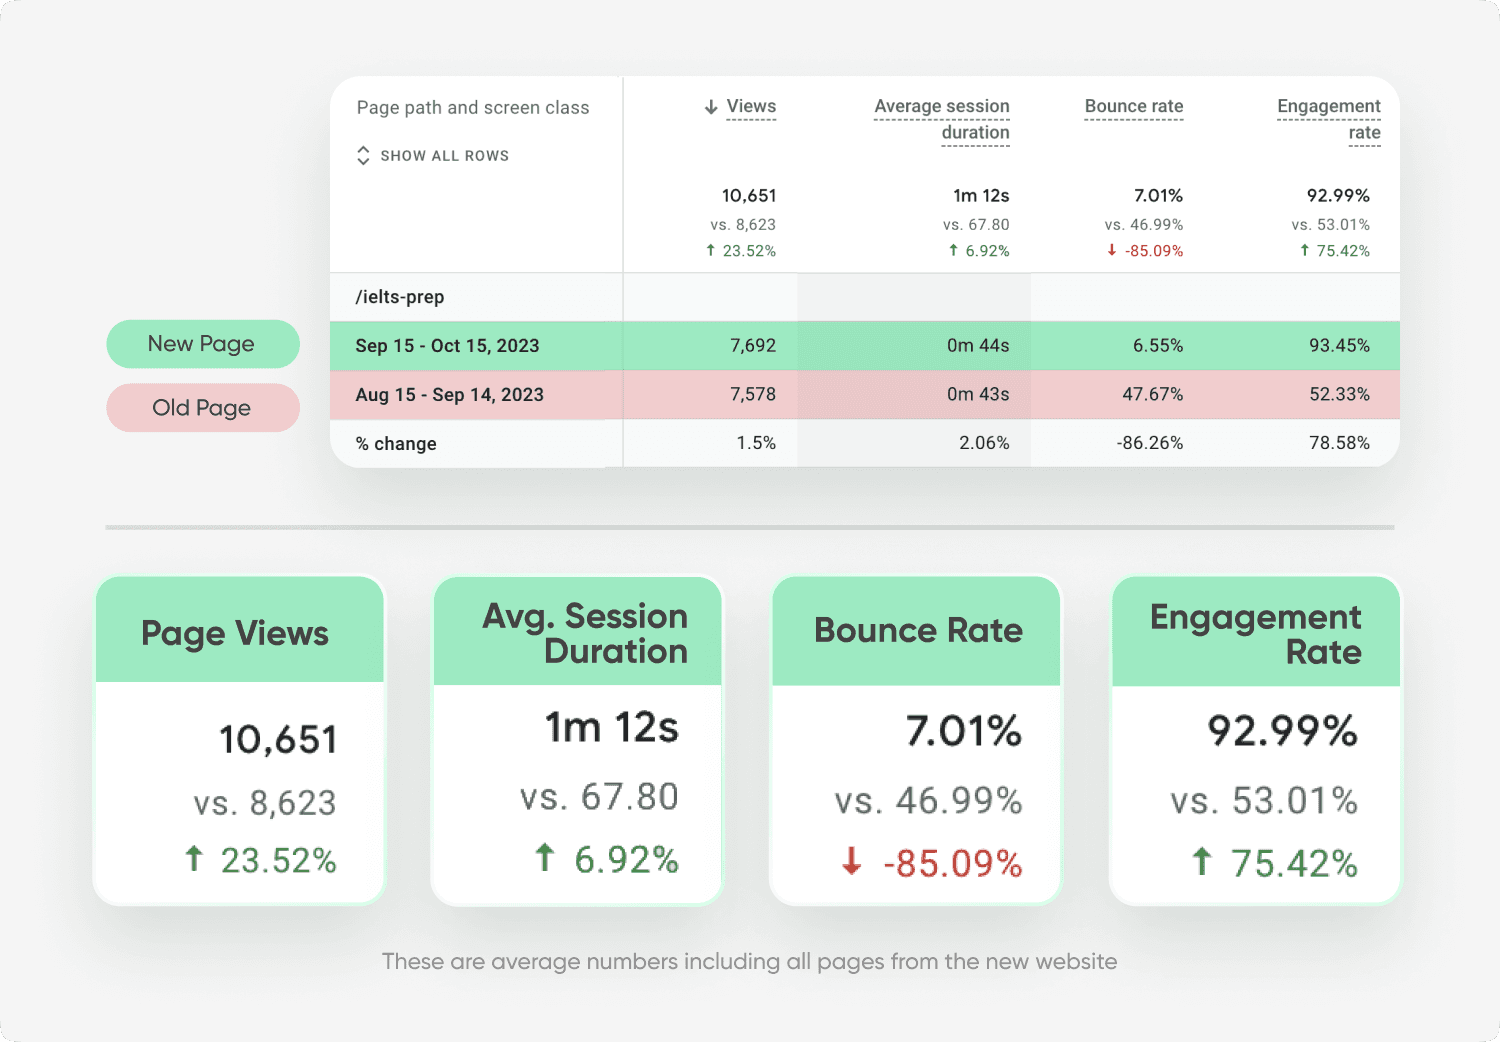
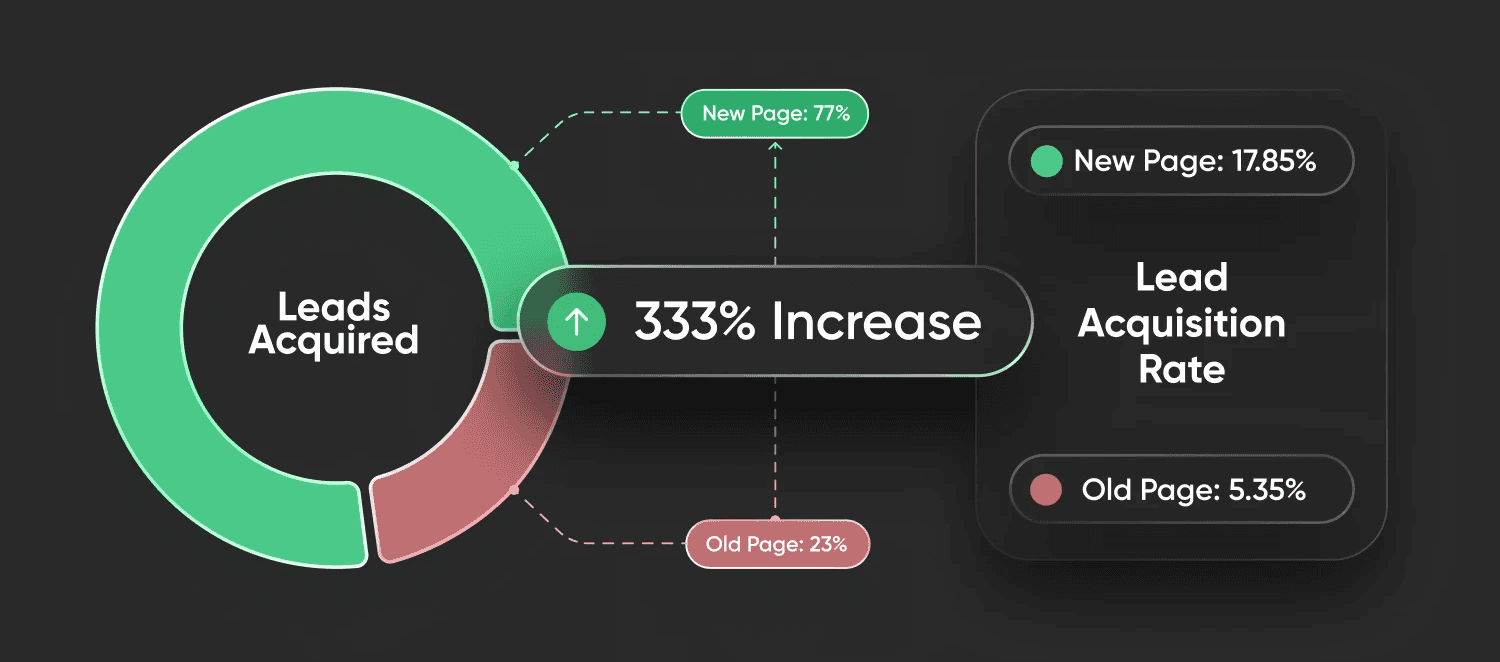
333% Increase
Lead Acquisition Rate
6.92% Increase
Session Duration
75.42% Increase
Engagement Rate
85% Decrease
Bounce Rate
This transformation was the result of a focused approach to data-driven product development, user-centric design, and agile execution.
The Problem: A Website That Wasn’t Converting
Despite growing organic traffic through successful SEO efforts, the website’s ability to turn visitors into leads was stagnant, with a lead acquisition rate of only 5.35%. Users found the content misaligned with their needs, while performance and design issues hindered engagement:
Page performance score: 34 due to bloated CSS.
Disjointed user experience: Lack of design consistency and poor content hierarchy.
Unstructured sitemap: Ineffective lead forms and unclear calls-to-action frustrated users.
Misaligned product pages: Focused too much on selling courses rather than answering user needs.

Step 1
Setting Clear Goals and KPIs.
My first step was to redefine success. I worked with stakeholders to identify key performance metrics:
🔼 Increase lead acquisition rate
⏳ Increase session duration
👁️ Increase engagement rate
🔻 Reduce bounce rate
These goals shaped the strategic direction of the project.
Step 2
Understanding unterserved user needs.
To design a solution that would resonate with users, I dove deep into both qualitative and quantitative research.
Qualitative Research:
I conducted interviews with 10 students from our Delhi center who had recently filled out a lead form. Their feedback provided critical insights:
💡 Insights from the interviews
Reputation and success rate were key decision factors for students when choosing coaching classes.
They valued personalized attention, with smaller batch sizes being a strong preference.
Quantitative Research:
By analyzing data from a high-performing Google Ads landing page, I uncovered a key insight:
💡 Insights from the Analysed Data
Over 60% of users downloaded free resources (like syllabus, exam pattern etc.) before considering classes. This reinforced the idea that users would be willing to exchange their information for valuable, free content.
Step 3
Designing the Solution – Lead Acquisition Through Value
Armed with these insights, I reimagined the website’s lead generation strategy. The core of the solution was to address users' needs first, building trust through helpful resources:

Lead Acquisition Magnet: The Free IELTS Prep Kit
A downloadable resource kit was created to provide exam preparation materials. This approach increased user engagement and contributed 22.3% of total leads on the new website.
Step 4
Aligning Teams, Wireframing and Prototyping
I led collaborative workshops with design, development, and marketing teams to create a wireframe that allowed them to work independently on deliverables. This approach saved time throughout the project and ensured smooth collaboration.
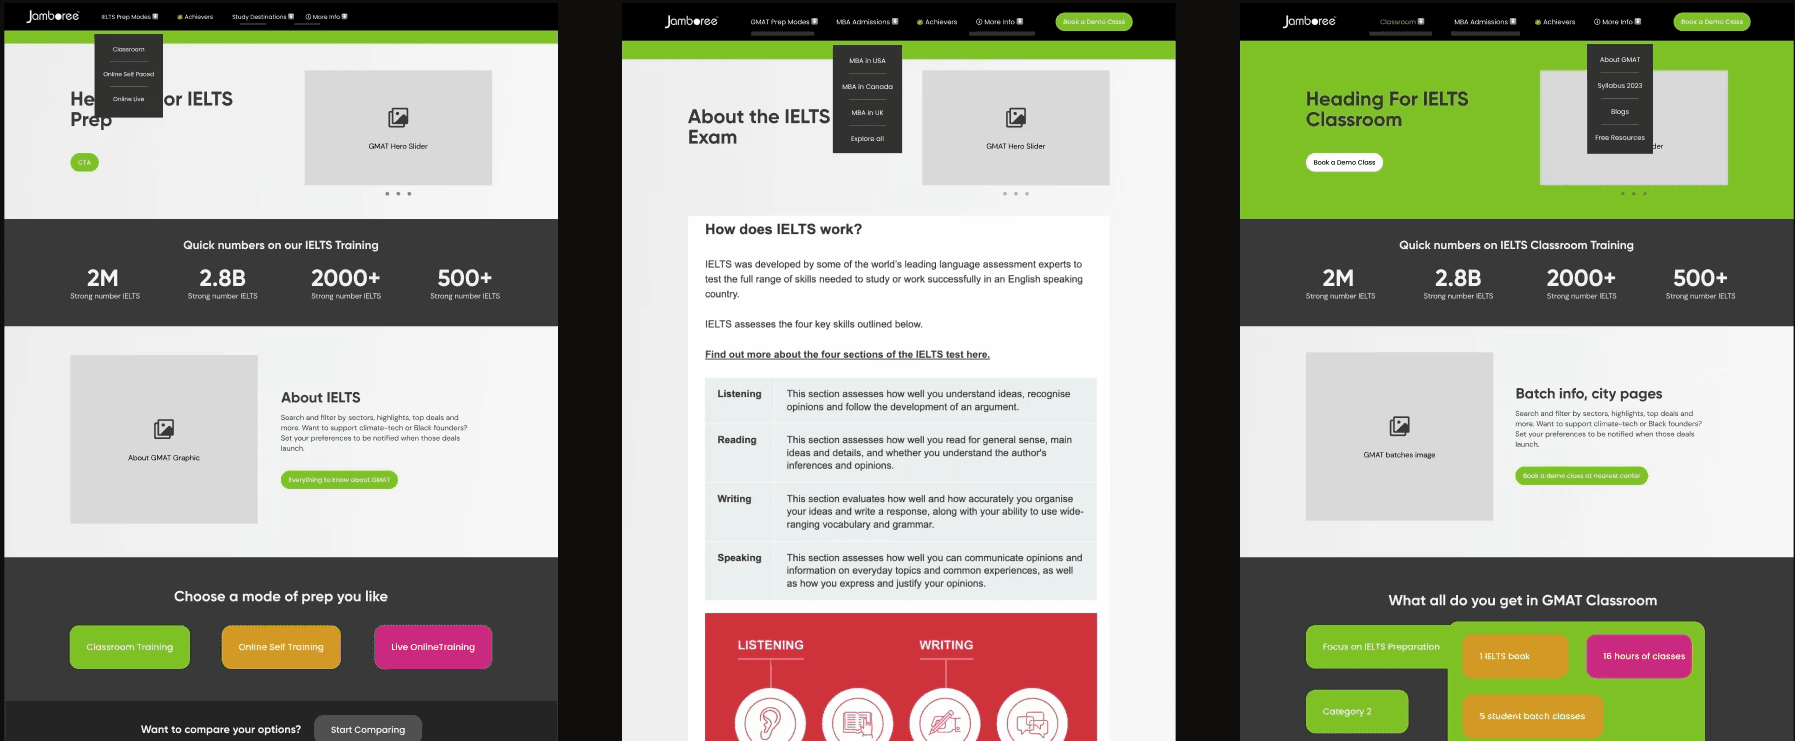
Wireframes
The wireframes focused on simplifying navigation, optimizing lead acquisition, and improving the user journey. We structured content with clear hierarchy, aligning CTAs with user intent, and integrated conversion points like the IELTS Prep Kit to drive engagement. These wireframes served as a blueprint for for the marketing, content and design teams.

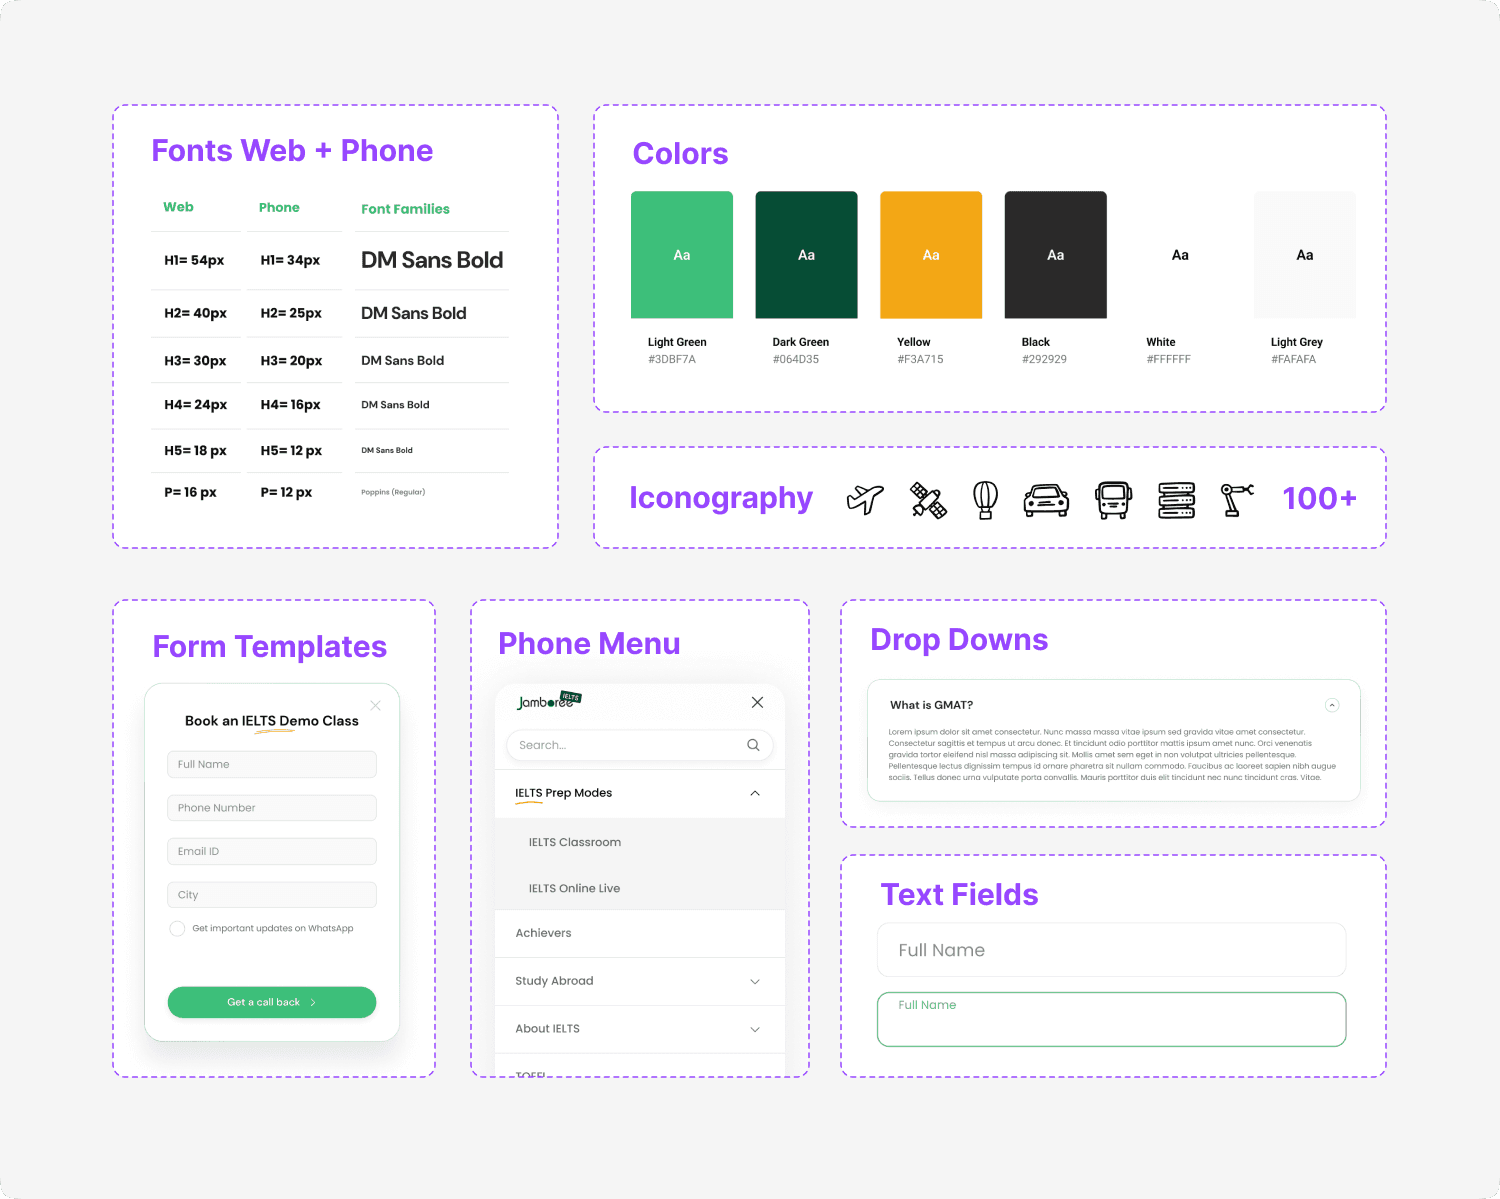
Design System
Built a scalable and consistent design system that improved the user experience while allowing flexibility for future iterations.
Step 5
Development & Sprint Management
I managed the development workflow from ideation through to delivery, using agile methodologies:
Sprint backlogs were tightly managed, ensuring that the entire project, including all key pages, was delivered on time.
The project was completed in 9 weeks, with an additional 3 weeks for content duplication and testing on more pages.
Step 6
Setting up analytics and performance tracking
For Quantitative Data & Analysis
1. Engagement Rate
2. Session Duration
3. Bounce Rate
4. Traffic & Lead Acquisition

For Qualitative Data & UX Feedback
1. Heatmaps
2. Session Recordings
3. User Path

For Security & Performance
1. CDN (Cloud Delivery Network) for high website speed.
2. Added Security against DDoS attacks
3. Smart Routing
The Outcome
A Data-Driven, User-Centered Success
By addressing user needs and aligning our strategy with clear performance goals, the redesigned website delivered exceptional results:
333% increase
in lead acquisition rate:
Users were now engaging with content that was meaningful to them.
75.42% increase
in engagement rate:
Interactive, relevant content kept users on the site longer.
85% decrease in bounce rate:
Optimized content and design significantly reduced the number of users leaving the site prematurely.
6.92% increase
in session duration:
The refined structure encouraged users to explore more of what the site had to offer.
A/B Test Results